




Exploring drivers of disparities, the Tulsa Health Department’s updated life expectancy report examines growing health disparities across Tulsa County, comparing life expectancy, socioeconomic conditions, and leading causes of death in North and South Tulsa. The analysis takes a deeper look at how premature deaths, particularly those related to accidents, drug and alcohol use, homicide and gun violence, contribute to these disparities. By exploring the underlying factors driving the gap, the report highlights the connection between economic conditions, access to resources and health outcomes across Tulsa communities.
This report updates a 2019 analysis of life expectancy across Tulsa County. The 2019 analysis used death data from 2015 – 2017; this update uses data from 2022 – 2024. As before, it compared North Tulsa and South Tulsa regions, along with 5 ZIP codes with the highest and lowest life expectancy (ZIP codes mostly overlap with the North and South regions). This update goes a step further with analysis of the ages at which people die from specific causes to better understand the drivers of the gap between these communities.
Tulsa County is home to the city of Tulsa, the second most populous city in the state of Oklahoma. According to the U.S. Census Bureau’s American Community Survey (2020 – 2024), there are an estimated 680,794 residents within the County. The South Tulsa Region has the largest population of the regions, and the Downtown Region has the smallest population within Tulsa County.
Figure 1. Tulsa County Regions
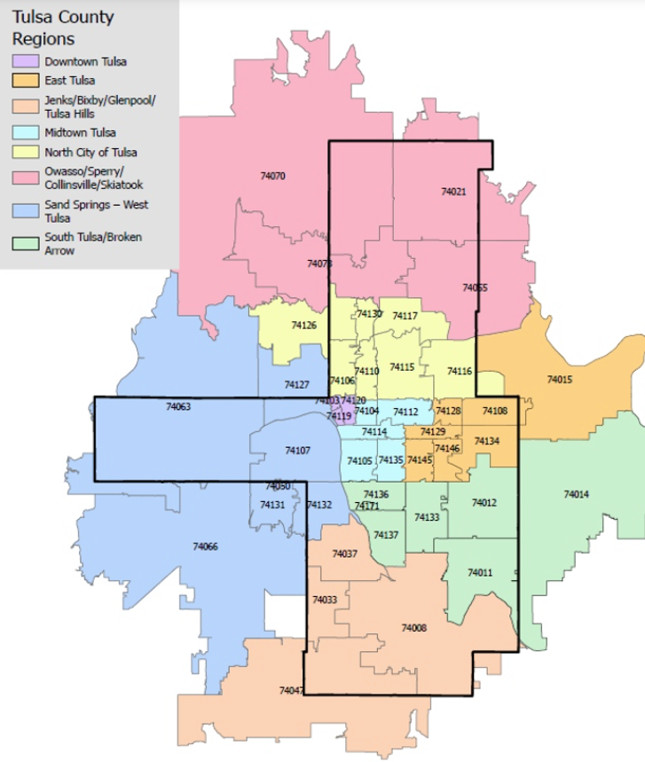
Life Expectancy (LE) is defined as the average number of years a group of people would expect to live from birth through their entire lifespan. LE is used globally to compare how long people in varying regions and of different races/ethnicities are expected to live and have many influencing factors such as genetics, healthcare access, diet, lifestyle choices and socioeconomic factors.
In 2019, the Tulsa Health Department’s data team conducted an analysis of LE across Tulsa County regions and ZIP codes. As part of that analysis, the team reviewed the social determinants of health in Tulsa County and found that the North Tulsa Region’s residents were younger overall than residents of the South Tulsa Region, had lower median income, higher percentages of minority populations, and higher percentages of female-headed family households with children under 18 living below the poverty level. The 2019 analysis showed a downward trend in LE for the North Tulsa Region, from 71.3 for the 2009-2011 period to 70.6 for the 2015-2017 period. This downward trend in the North Tulsa Region continued into 2024, with LE in this region decreasing from 70.6 for the 2015-2017 period to 69.2 in the 2022-2024 period.
Additionally, the 2019 analysis revealed that mortality rates for injury related deaths such as accidental deaths, homicide and gun-related deaths remained higher in the North Tulsa Region than in the South Tulsa Region. Since that analysis, age-adjusted mortality from accidental deaths in the North Tulsa Region almost doubled from 71.5 per 100,000 population in the 2015-2017 period to 138.0 in the 2022-2024 period. Accidental deaths from drugs and alcohol made up more than half (55.3%) of accidental deaths in the North Tulsa Region in the 2022 – 2024 period and contributed to this increase. Homicide rates in the region decreased from 36.4 for the 2015-2017 period to 29.1 for the 2022-2024 period and gun-related deaths stayed relatively stable in the North Tulsa Region from 40.9 in the 2015-2017 period to 40.6 in the 2022-2024 period.
The current analysis takes a deeper look at life expectancy and explores the main drivers of the LE gap between the North and South Tulsa regions and the 5 ZIP codes with the highest and the lowest LEs in Tulsa County. In this exploration, the focus is less on the social determinants of health, and more of an analysis of the causes of death, with a focus on causes of death by age group to help uncover additional drivers of these disparities between ZIP codes and regions. The causes examined by age group in this report include heart disease and cancer for comparison with injury associated deaths by homicide, gun-related deaths and accidental deaths. Accidental deaths were examined as a whole and broken out by motor vehicle deaths and accidental deaths due to drug or alcohol use. Accidental deaths due to drugs or alcohol are part of what some researchers have termed “Deaths of Despair” (Case & Deaton, 2015; Friedman and Hansen, 2024). Indeed, according to Friedman and Hansen, “Rising inequalities in deaths of despair among American Indian and Alaska Natives and Black individuals were largely attributable to disproportionate early mortality from drug- and alcohol-related causes.”
This analysis intends to inform the prioritization of public health resources and initiatives that are important to protect and support Tulsa County communities in pursuit of their health goals.
The current analysis of Tulsa County regions reviewed ZIP code level LE and found that four of the five ZIP codes with the lowest LE were in the North Tulsa Region and one (74131) was in the Sand Springs/West Tulsa Region. For the ZIP codes with the highest LE, two (74137 and 74133) were in the South Tulsa Region, one (74037) was in the Jenks/Bixby Region, one (74114) was in the Midtown Region and one (74055) was in the Owasso/Sperry Region.
At the regional level, for the 2015-2017 period the difference in LE between the North Tulsa Region (70.6) and the South Tulsa Region (79.0) was 8.4 years. The current analysis using data from the 2022-2024 period finds the difference in LE between the North Tulsa Region (69.2) and the South Tulsa Region (78.3 years) to be 9.1 years.
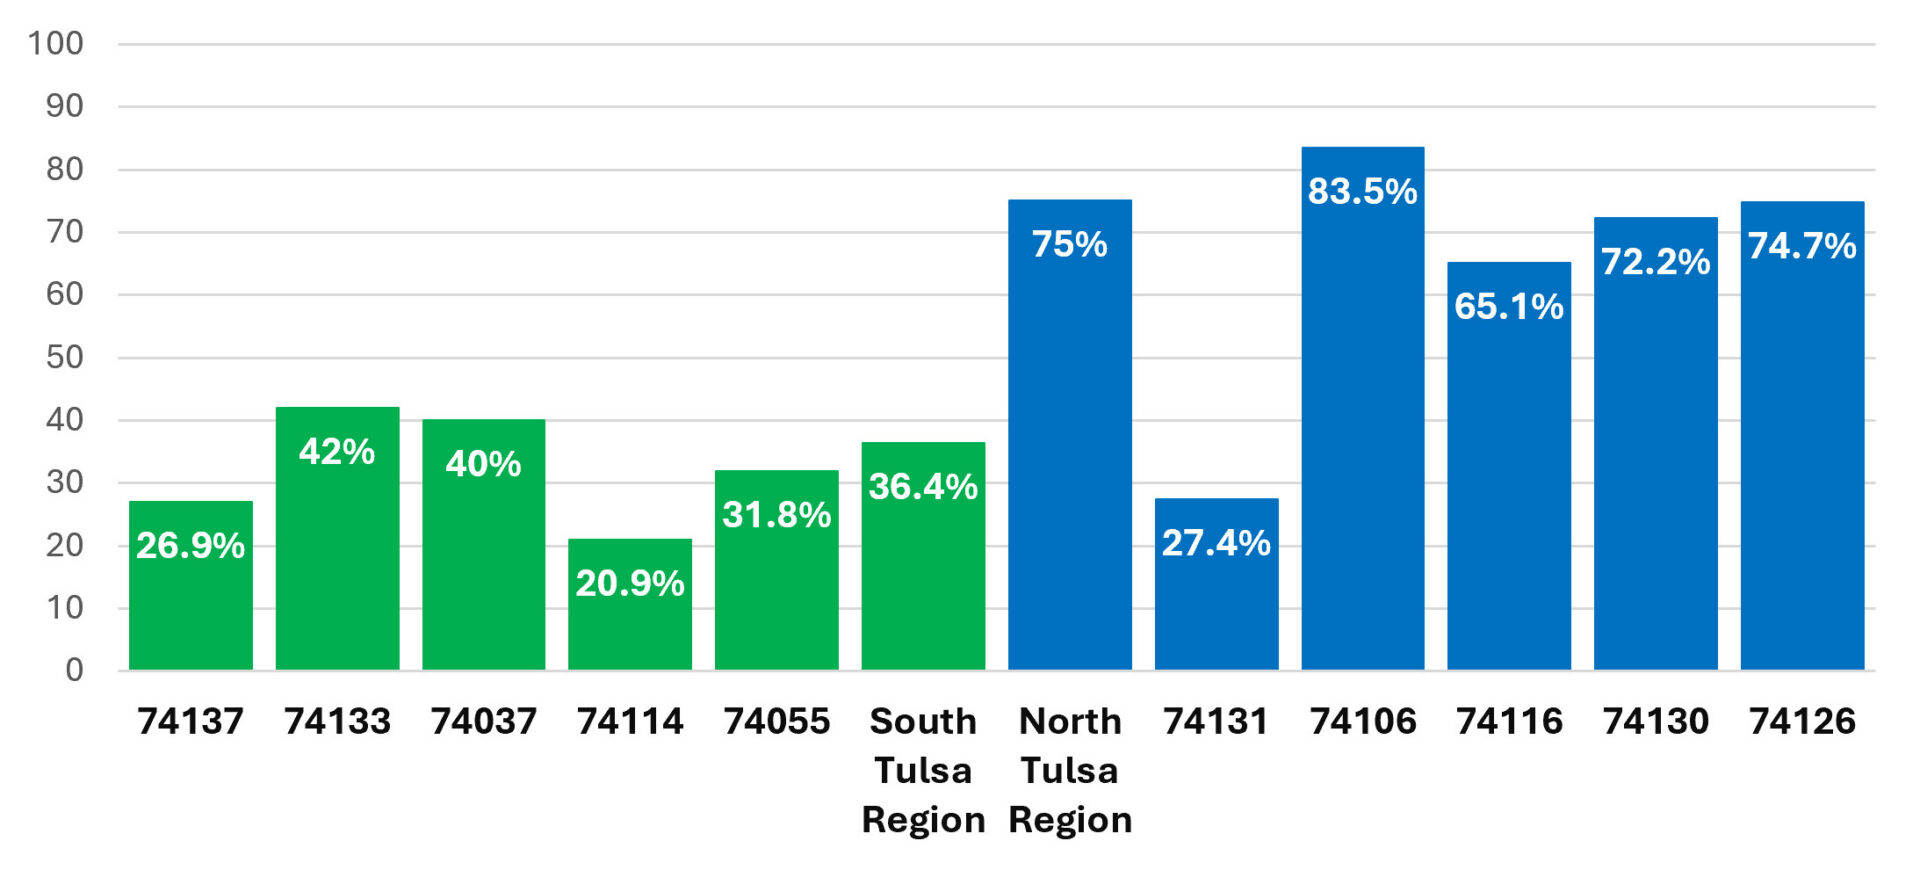
In terms of race, for the 2015-2017 period the difference in LE for White residents (77.2 years) and Black residents (69.3 years) was 7.9 years. In the 2022-2024 period, the difference in LE for White residents (76.2 years) and Black residents (68.3 years) of Tulsa County was also 7.9 years. In both time periods, Black men had the lowest LE in Tulsa County, at 64.1 years in 2022-2024 (64.6 in 2015-2017), compared to their white male counterparts at 73.5 years in 2022-2024 (74.7 years in 2015-2017), which is a difference of 9.4 years in 2022-2024 (10.1 years in the 2015-2017 period). In the North Tulsa Region in 2024, 75% of the population were Black, Indigenous and other people of color (72.1% in 2017), while the population of South Tulsa was 63.6% White (70.8% in 2017).
Figure 2. Top 5 Lowest (blue) et Highest (green) Life Expectancy ZIP Codes in Tulsa County, 2022-2024
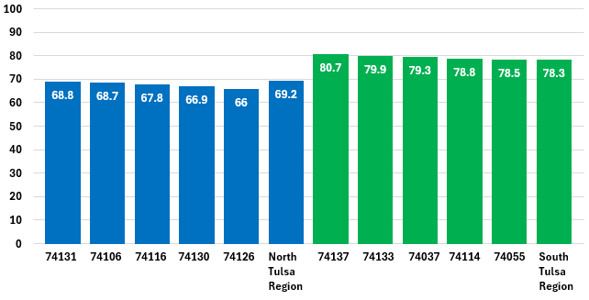
After confirming that most of the demographic indicators (apart from median household income) remained relatively stable through 2024, the analysis expanded to explore why these disparities in LE persisted and widened, from 2017 to 2024. This analysis investigated the differences by age group for deaths by accidents (unintentional injuries), motor vehicle accidents, accidental deaths from drugs or alcohol, homicide and gun-related deaths across the highest LE ZIP codes and the lowest LE ZIP codes and the North Tulsa and South Tulsa Regions.
Studies have shown that more deaths in younger age groups have the greatest impact on life expectancy overall (Orgera et al., 2024; Fenelon al., 2016). When there are large concentrations of death in younger age groups, many decades of expected life are lost, which lowers the life expectancy for the whole group. In terms of causes of death at younger ages, the literature suggests that deaths in people in younger age groups occur mostly from accidental deaths such as motor vehicle accidents, gun-related deaths, homicide, and alcohol and drug related deaths. The current report echoes similar themes and will be discussed in more detail within the age group analysis section of this report.
Research examining racial disparities in relation to life expectancy has consistently found lower life expectancies among Black and Native American/Alaskan Native populations (Ndugga et al., 2026) and our current study reflects similar findings.
Life expectancy in this report is life expectancy at birth: the average number of years a newborn would be expected to live if the death rates observed in 2022 – 2024 stayed the same throughout their life. (Office for National Statistics, 2023).
To calculate life expectancies used in this report, age specific mortality rates were estimated by counting the number of age-specific deaths in the time interval (2022-2024) and dividing by the total observed population alive at a given point within that interval. A published mathematical formula is used to model how the force of mortality changes within and across age-intervals (Ortiz-Ospina, 2017).
Crude mortality rates are calculated by dividing the number of deaths for each cause reported in each age group by the population number for each age group and then multiplying that number by 100,000 to give the crude rate per 100,000 population. Because some ZIP codes had few deaths from a given cause, ZIP code level rates and percentages can change sharply with one or two deaths and should be interpreted with caution. Age-adjusted mortality rates account for differences in the age makeup of each population, so that areas with older or younger residents can be compared fairly.
Mortality data was obtained from Vital Statistics, Center for Health Information, at the Oklahoma State Department of Health (2022 through 2024) and population data was obtained using 5-Year estimates from the American Community Survey for the same time interval.
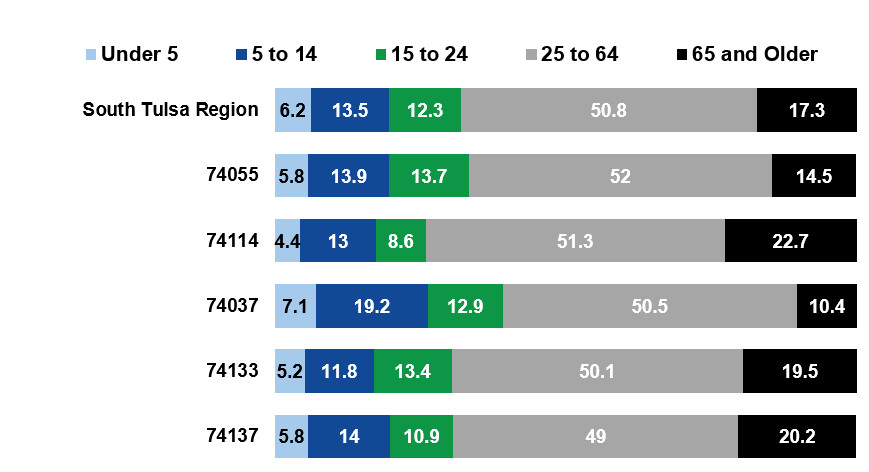
The South Tulsa Region (population 252,820) had more than three times the number of individuals within its region than the North Tulsa Region (population 70,997). Overall, the populations in the lower LE ZIP codes and the North Tulsa Region are younger than the populations in the higher LE ZIP codes and the South Tulsa Region.
Figure 3. Total Population in Selected regions and in ZIP Codes with Lowest (blue) and Highest (green) Life Expectancies
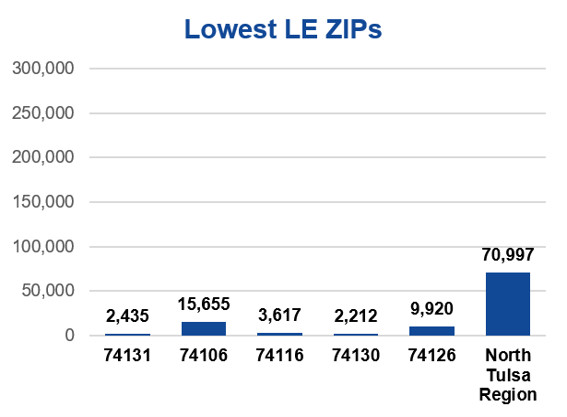
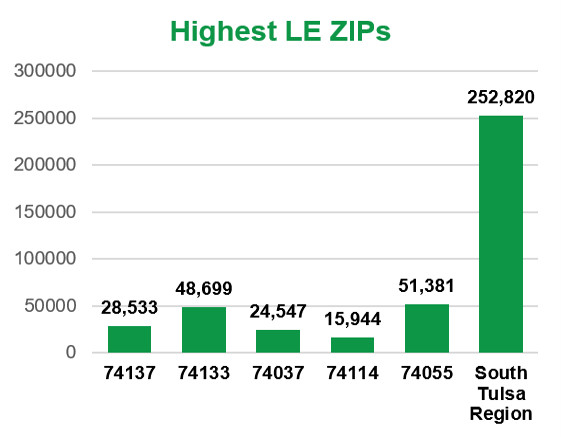
Figure 4. Age Group Breakdown and Comparison by ZIP Code and Selected Region
The North Tulsa Region and lowest LE ZIP codes had higher percentages of residents that were Black, Indigenous or people of color than the South Tulsa Region and highest LE ZIP codes whose residents were more commonly white.
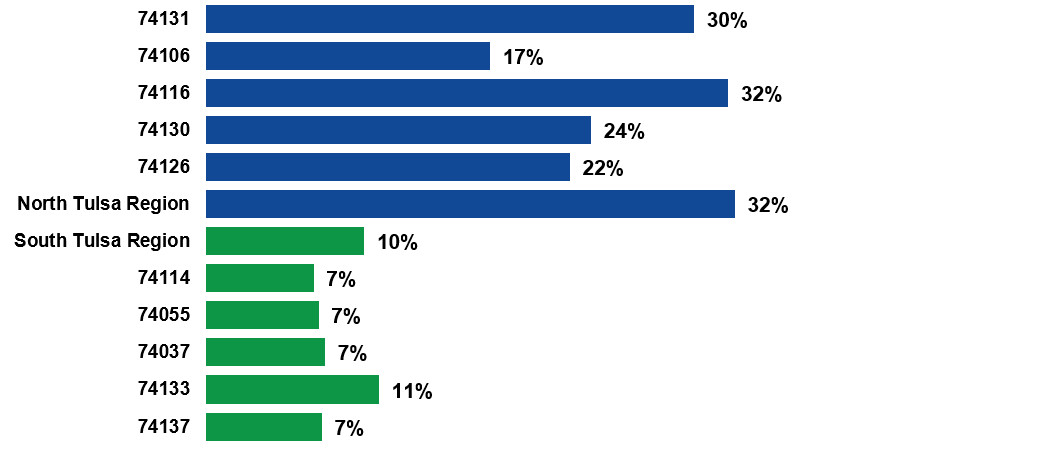
Research suggests that those with higher poverty levels have substantially lower life expectancy compared to those with lower poverty levels (Singh & Lee, 2021). When the median household incomes (inflation adjusted) are compared by region and ZIP code, those who lived within the North Tulsa Region and ZIP codes with lowest LE had lower median household incomes and higher percentages of their population living below the poverty line than those who lived in the South Tulsa Region and the ZIP Codes with the highest LEs.
Figure 5. Percent of Residents that are Black, Indigenous or People of Color by Selected Region and ZIP Code
The overall Tulsa County median income was $69,009; the North Tulsa Region’s overall median income was $45,243. There was a $38,880 difference between the median household income for the South Tulsa Region ($84,123) and the median household income of the North Tulsa Region. In 2017 (and reported in the 2019 Life Expectancy analysis conducted by the THD data team) the overall median income for Tulsa County was $52,017. For the North Tulsa Region at that time, the median income was $43,542 and in the South Tulsa Region was $68,048 (a difference of $24,506). After adjusting for inflation, the gap in median household income between the two regions grew by about 24%, from $31,361 to $38,880 (in 2024 dollars.) In practical terms, since the 2019 analysis through 2024, the typical South Tulsa household had $231,000 more to spend than the typical North Tulsa household.
These findings show stark differences, that compound over time, in the resources available to residents and their socioeconomic status between regions and ZIP codes. The almost double median income in the South Tulsa Region compared to the North Tulsa Region places the residents of the South Tulsa Region in a much better financial position to obtain resources that can impact LE.
Figure 6. Percent of Population Living Below the Poverty Line by Selected Region and ZIP Codes with the Lowest (blue) and Highest (green) Life Expectancy
Access to healthcare is a very important factor that can impact LE. Using health insurance coverage as a proxy to measure healthcare access can help determine why some individuals may or may not be able to seek diagnostic care and treatment for diseases or health concerns that can significantly impact early mortality.
This analysis found that health insurance coverage varied between the North and South Tulsa regions as well as the highest LE ZIP codes and the lowest LE ZIP codes. In 2024, the percentage of residents of the North Tulsa Region who had health insurance coverage was 77.5% compared to 90.1% for the South Tulsa Region.
Figure 7. Percent of Population with Health Insurance by Selected Regions and ZIP Codes with the Lowest (blue) and Highest (green) Life Expectancy
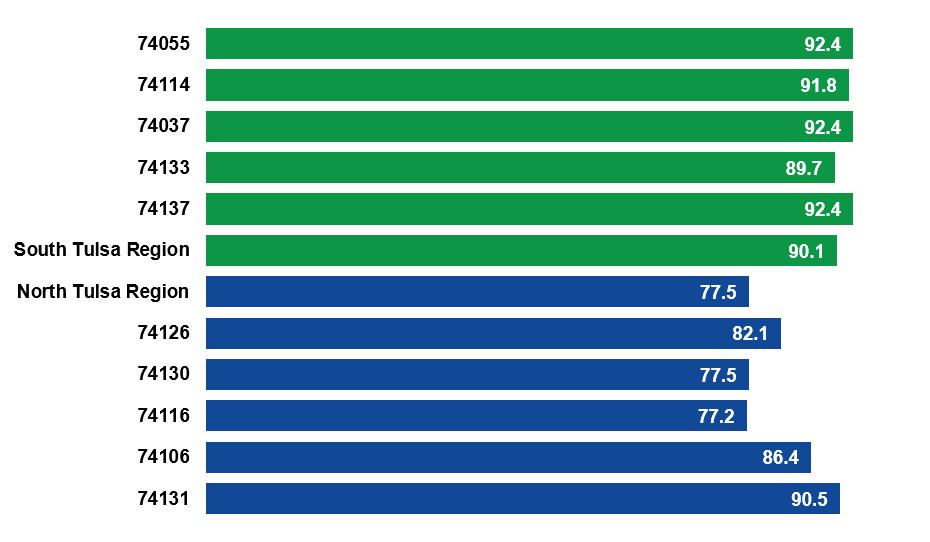
Insurance coverage does not always equate to healthcare access, as financial constraints related to co-pays, deductibles, travel costs, and other social factors such as health literacy, trust in systems, and being underinsured can still impact decisions related to pursuing health care interventions. Income gaps and social factors play a heavy role in healthcare utilization and LE, and the percent of a population with health insurance should only be considered as an absolute best-case scenario for access in the North Tulsa Region.
A 2021 report by the Wall Street Journal (Ramachandran, 2021) found that the South Tulsa Region hosts a concentration of medical resources, including three general hospitals and multiple psychiatric facilities whereas the North Tulsa Region lacks urgent and specialized medical infrastructure which can increase travel times to healthcare.
The top leading causes of death both nationwide and in Tulsa County have remained relatively consistent over time. The current analysis identified the primary cause of death varied in notable ways between ZIP codes with the highest LE and the lowest LE in Tulsa County, as well as in the regions.
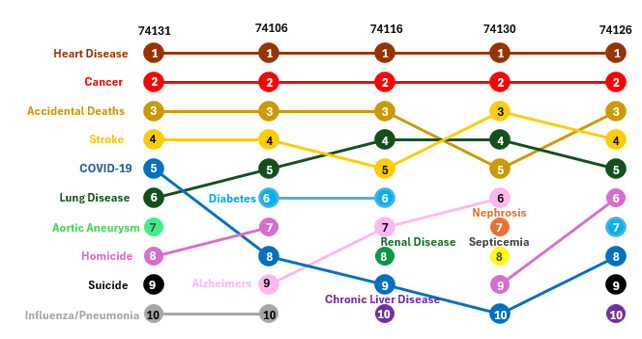
Nine of the top 10 causes of death had higher age-adjusted mortality rates in the North Tulsa Region than in the South Tulsa Region. For causes such as heart disease, the North Tulsa Region had a mortality rate that was 1.65 times higher than South Tulsa Region, although it was the leading cause of death for both regions. This trend was similar for the second and third leading causes of death, cancer and accidental death, at 1.35 times higher and 2.5 times higher, respectively, in the North Tulsa Region than in the South Tulsa Region. Additionally, the mortality rate for Diabetes in the North Tulsa Region was more than double the rate in the South Tulsa Region. The North Tulsa Region included homicide in the top 10 causes of death, while the South Tulsa Region included Chronic Liver Disease and Cirrhosis but did not include Homicide. Notable in Figure 8 and 9, four of the five ZIP codes with the lowest LE have homicide included in the top 10 Causes of Death, while none of the ZIP codes with the highest LE include homicide. Also notable, the ZIP codes with the lowest LE in Tulsa County include accidental deaths as the third leading cause of death for all five ZIP codes, while only three of the five ZIP codes with the highest LE include accidental deaths in their top three causes.
Figure 8. Top 10 Causes of Death-by-Death Rate per 100,000 for South Tulsa (green) and North Tulsa (blue) Regions
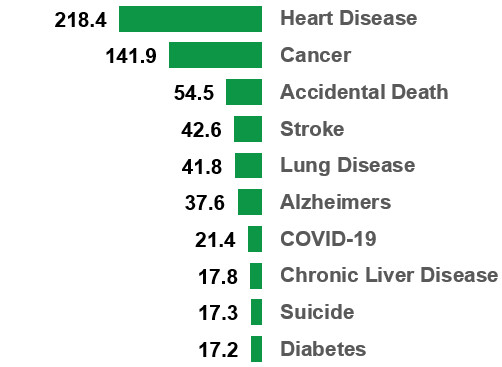
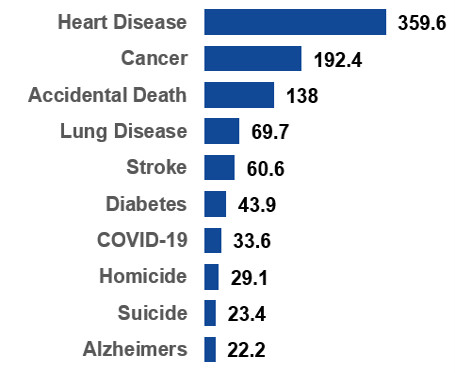
Figure 9. Top 10 Causes of Death Among Tulsa County ZIP Codes with the Highest Life Expectancy. 74137 and 74133 are in South Tulsa. 74037 is in Jenks/Bixby, 74114 is in Midtown and 74055 is in Owasso/Sperry Region
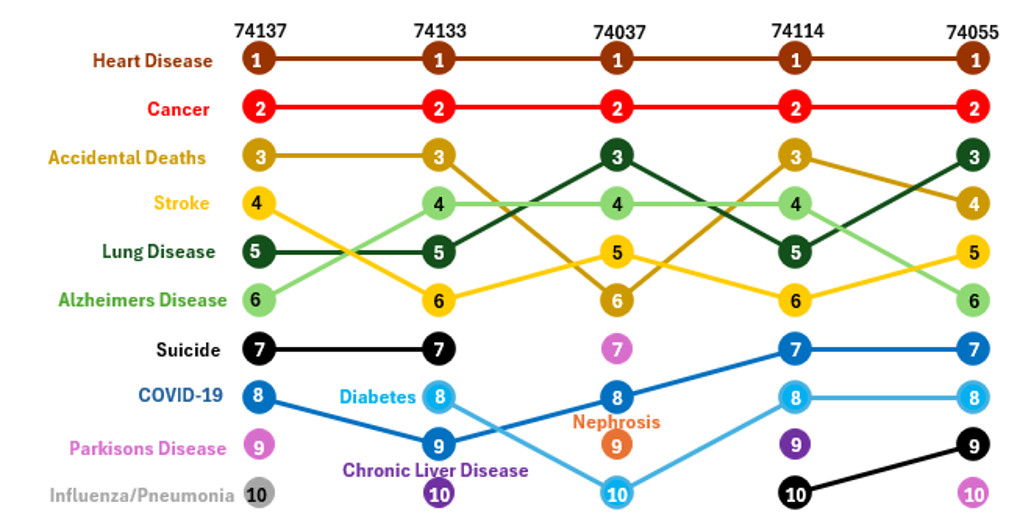
Figure 10. Top 10 Causes of Death Among Tulsa County ZIP Codes with the Lowest Life Expectancy. 74131 is in Sand Springs/West Tulsa and the Other ZIP Codes are all located in North Tulsa
Many studies have focused on the social determinants of health that impacts LE such as income levels, poverty, educational attainment, female-headed households. One less often emphasized aspect in local analysis on LE disparities is the fact that deaths in younger age groups have a major impact on LE and can substantially lower the LE for the group overall. Small spikes in young adult deaths alter the overall average much more than small changes in elderly deaths.
According to the Centers for Disease Control and Prevention (CDC, 2024), injury is the leading cause of death among people ages 1-44. The webpage for the CDC, Injury Prevention and Control states that, “In the first half of life, more Americans die from injuries and violence than from any other cause.” A study published in PLOS One (Light & Vachuska, 2024) found that homicide is one of the principal reasons why lifespans have become shorter for Black men than White men in recent years. For this report, we examine the mortality rates for accidental deaths (overall and then broken out into motor vehicle deaths and accidental deaths due to drugs or alcohol), homicides and gun-related deaths by age group, to explore the possibility that more deaths in the younger age groups for these causes might be key drivers in the disparities in Life Expectancy across the regions and ZIP codes analyzed.
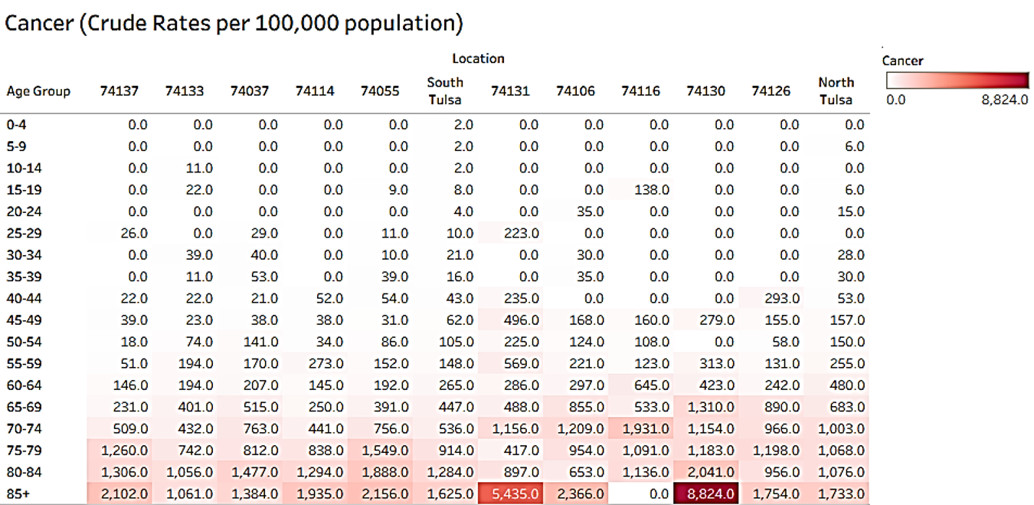
The figures below show the crude mortality rates by age group for all the ZIP Codes included in this analysis, as well as for the North and South Tulsa regions. These figures are designed to show more intense color as the rate goes up. The figures show the ZIP Codes with the highest Life Expectancies (and the South Tulsa Region) on the left side and the ZIP Codes with the lowest Life Expectancies (and the North Tulsa Region) on the right side. The first figures show rates for heart disease and cancer. Because the North Tulsa Region has a younger population than the South Tulsa Region, a larger share of its deaths would be expected to occur at younger ages, even if death rates were the same. The age-group rates in these figures are not affected by this difference, and they show higher rates in the North Tulsa Region in every age group from 15 – 19 through 45 – 49 for accidental deaths, homicide and gun-related deaths, and also holds true for all but one age group for motor vehicle deaths.
Figure 11 shows clearly that more deaths from heart disease occur in the older age groups than in the younger age groups for both regions and all ZIP Codes. Figure 12, crude rates for deaths from Cancer follows the same trend for age indicating that specific causes of mortality are primarily impactful on LE in the elder years of life. For both regions, fewer than 10% of deaths from heart disease or cancer occurred in residents under 50 (heart disease: North Tulsa Region at 8.5%, South Tulsa Region at 3.2%; cancer: North Tulsa Region at 9.2%, South Tulsa Region at 6.1%) (see Table 1).
Figure 11. Crude Death Rates of Heart Disease by Age (per 100,000 population) for Selected Regions and ZIP Codes
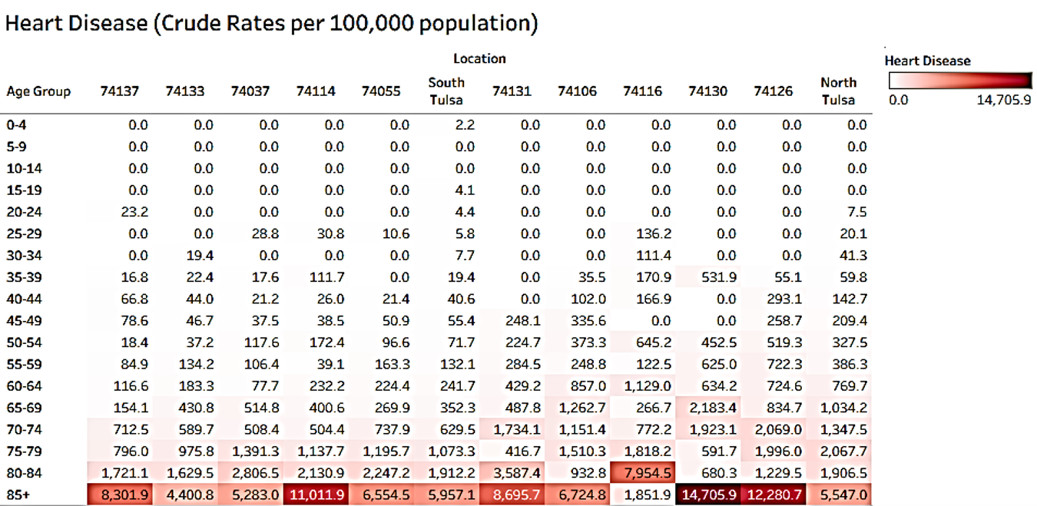
Figure 12. Crude Death Rates of Cancer by Age (per 100,000 population) for Selected Regions and ZIP Codes
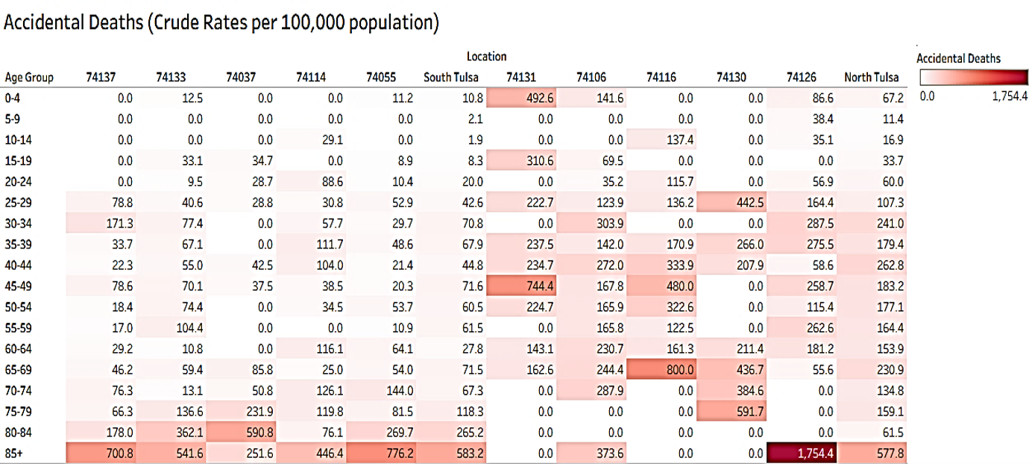
Figures 13-17 show the crude mortality rates for accidental deaths*, motor vehicle deaths, accidental deaths from drugs or alcohol, homicide and gun-related deaths for the five ZIP codes (and the South Tulsa Region) with the highest Life Expectancies and the 5 ZIP codes (and the North Tulsa Region) with the lowest Life Expectancies in 2024.
Figure 13. Crude Death Rates of Accidental Deaths by Age (per 100,000 population) for Selected Regions and ZIP Codes
*Accidental deaths include motor vehicle accidents, other land transport accidents, water, air and space and other unspecified transport accidents and their sequelae, falls, accidental drowning and submersion, accidental discharge of firearms, accidental exposure to smoke, fire and flames, accidental poisoning (which includes unintentional drug overdoses,) and exposure to noxious substances and other and unspecified non-transport accidents and their sequelae.
In contrast to Figure 11 and 12 for heart disease and cancer, Figure 13 illustrates a clear difference in accidental deaths by age groups in the South Tulsa Region and the ZIP codes with the highest LEs and the North Tulsa Region and the ZIP codes with the lowest LEs. For accidental deaths, deaths in residents under 50 years of age accounted for 38.2% of the deaths in the South Tulsa Region, and 58.8% of the deaths in the North Tulsa Region (see Table 1).
Motor vehicle accidents are a subset of accidental deaths and account for 23.9% of the accidental deaths in Tulsa County overall during the 2022-2024 period (14.2% in the South Tulsa Region and 15.6% in the North Tulsa Region).
Figure 14. Crude Death Rates of Motor Vehicle Deaths by Age (per 100,000 population) for Selected Regions and ZIP Codes
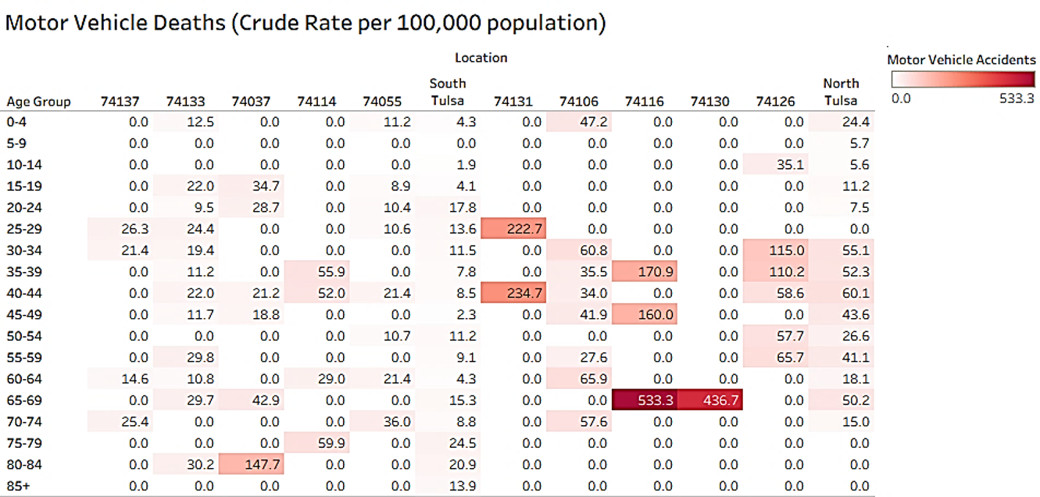
Figure 14 shows a clear difference in the deaths by age group for the South Tulsa Region and the higher LE ZIP codes and the North Tulsa Region and the lower LE ZIP codes.
Motor vehicle deaths to people under 50 years old accounted for 53.0% of motor vehicle deaths in the South Tulsa Region and for 69.8% of Motor Vehicle deaths in the North Tulsa Region (see Table 1).
Accidental deaths from drugs or alcohol are another subset of accidental deaths that accounted for 45.5% of the overall accidental deaths in Tulsa County during the 2022-2024 period (38.8% in the South Tulsa Region and 55.3% in the North Tulsa Region). Figure 15 shows, that death rates from accidental drug or alcohol deaths were higher in the North Tulsa Region than in the South Tulsa Region in nearly every adult age group.
Figure 15. Crude Death Rates of Accidental Deaths from Drugs or Alcohol by Age (per 100,000 population) for Selected Regions and ZIP Codes
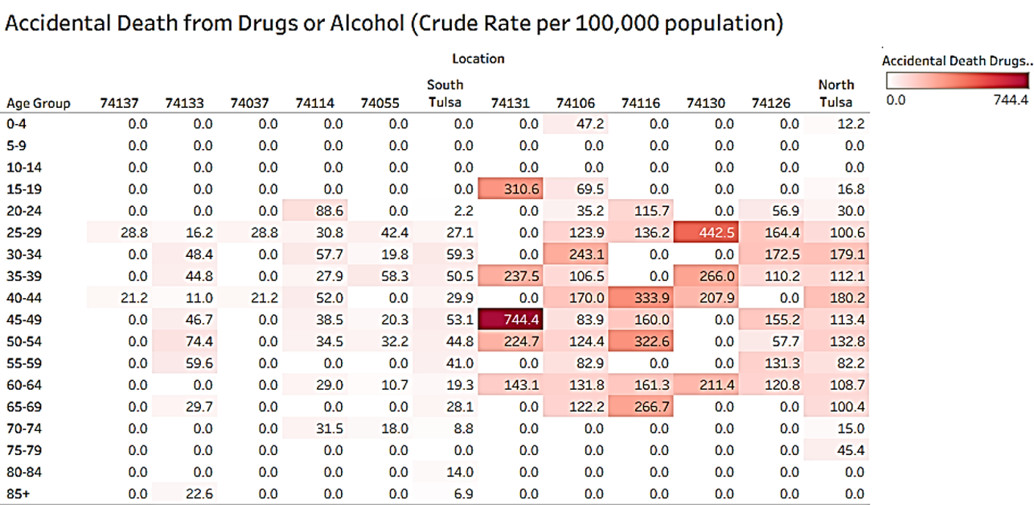
In the North Tulsa Region, rates were above 100 in every age group from 25 – 29 through 65 – 69, except 55 – 59, while no age group in the South Tulsa Region was above 60. Among residents aged 40 – 44, for example, the North Tulsa rate (180.2) was six times the South Tulsa rate (29.9). Accidental Deaths due to drugs or alcohol to people under 50 years old accounted for 63.0% of this type of accidental death in the South Tulsa Region and for 67.1% in the North Tulsa Region (see Table 1).
Figure 16 displays the crude mortality rates for Homicide in the South Tulsa Region and the ZIP codes with the highest LEs in Tulsa County and the North Tulsa Region and ZIP codes with the lowest LEs in Tulsa County. Homicide deaths include gun-related deaths, but can also occur via other mechanisms, such as sharp objects, blunt force or poisoning. Homicide deaths tend to occur in younger age groups for both high LE and low LE regions and ZIP codes. However, the rates of homicide deaths are higher in the North Tulsa Region and the lowest LE ZIP codes than in the South Tulsa Region and the highest LE ZIP codes. Additionally, the percentage of homicide deaths to residents under 50 years old was higher in the North Tulsa Region (91.2%) than in the South Tulsa Region (77.8%; see Table 1).
Figure 16. Crude Death Rates of Homicide by Age (per 100,000 population) for Selected Regions and ZIP Codes
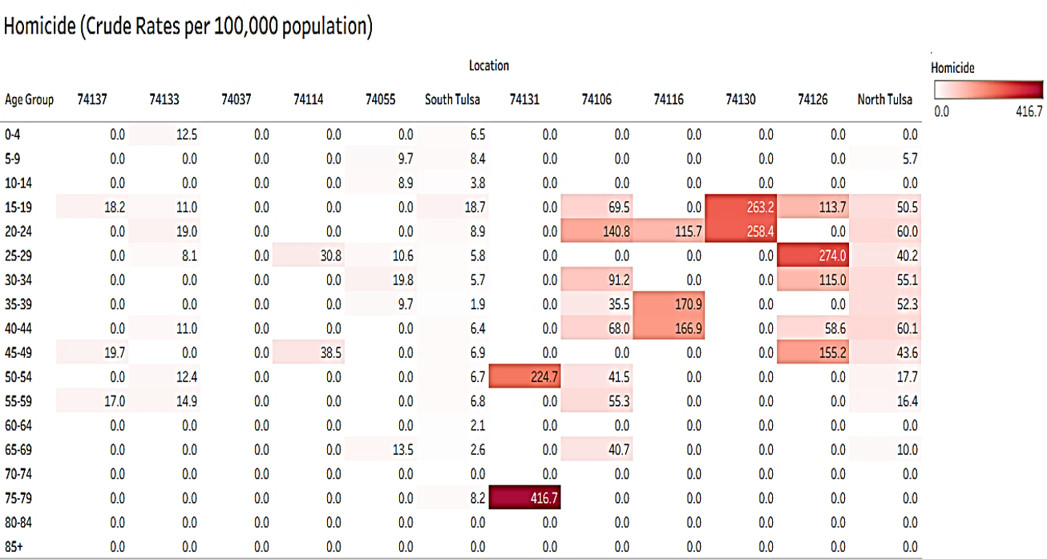
While Homicide includes gun-related deaths, gun-related deaths also include suicides, accidental/unintentional discharges, legal interventions and deaths of undetermined gun-related intent. Figure 17 shows a striking difference in crude mortality rates for gun-related deaths by age group between the South Tulsa Region and the ZIP codes with the highest LEs in Tulsa County and the North Tulsa Region and the ZIP codes with the lowest LEs in Tulsa County.
Figure 17. Crude Death Rates of Gun-Related Deaths by Age (per 100,000 population) for Selected Regions and ZIP Codes
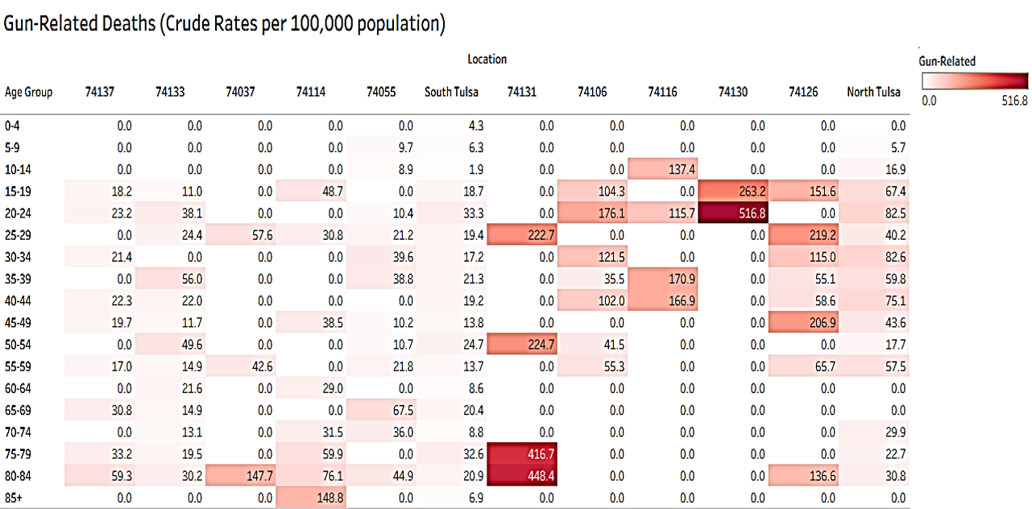
The crude mortality rates for gun-related deaths are notably higher in the North Tulsa Region and the ZIP codes with the lowest LEs than in the South Tulsa Region and the ZIP codes with the highest LEs in Tulsa County. The percentage of people dying in gun-related deaths who were under 50 in the North Tulsa Region was 84.0% and 63.0% in the South Tulsa Region (see Table 1).
Table 1 – Percent of deaths occurring before age 50
Cause | South Tulsa | North Tulsa | Higher-LE ZIPs | Lowest-LE ZIPs |
Maladie cardiaque | 3.2% | 8.5% | 2.2 – 4.0% | 30.0 – 11.4% |
Cancer | 6.1% | 9.2% | 2.6 – 9.7% | 5.6 – 15.4% |
Accidental deaths | 38.2% | 58.8% | 28.2 – 48.4% | 42.9 – 72.7% |
Motor vehicle | 53.0% | 69.8% | 50.0 – 71.4% | 0 – 100% |
Drugs or alcohol | 63.0% | 67.1% | 55.2 – 100% | 50-0 – 75.0% |
Homicide | 77.8% | 91.2% | 66.7 – 100% | 0 – 100% |
Gun-related | 63.0% | 84.0% | 37.5 – 59.3% | 25 – 100% |
As a thought experiment, an additional analysis was completed of what LEs would look like in the ZIP Codes and regions included in this report if the injury associated deaths (accidental poisoning due to alcohol and drugs and suicide, homicide and motor vehicle accidents) were removed for the age groups under 50 years old. This thought experiment shows a best-case scenario, which most likely would not be attainable, as it would be hard to prevent all these causes of death for all people under 50 years old.
Figure 18 below shows what the Life Expectancies for the selected ZIP codes and regions look like as they were during the 2022-2024 period compared to what they would look like if the causes of death discussed above were removed for the age groups under 50 years old.
Figure 18. Gains in Life Expectancy Before (blue) et After (green) Removing Injury Deaths
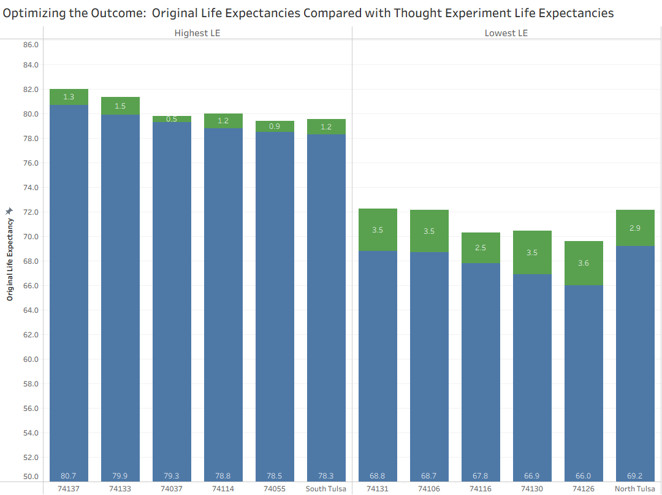
Figure 18 shows that LEs improved for all the ZIP codes and regions discussed in this report when deaths in residents under 50 for injury associated deaths (accidental poisoning due to alcohol and drugs and suicide, homicide and motor vehicle accidents) were eliminated. While there were improvements among all ZIP codes and regions, the improvements in the low LE ZIP codes and North Tulsa Region were higher compared to those of the Higher LE ZIP codes and South Tulsa Region. Three of the five ZIP codes with the lowest LE improved by 3.5 years (74130, 74106 and 74131) and ZIP code 74126 improved by 3.6 years, while the ZIP codes with the highest LEs improved by 1.5 years (74133) or less. For the regions, the North Tulsa Region overall improved by 2.9 years, and the South Tulsa Region improved by 1.2 years. While preventing all the deaths for people under 50 years old by the selected causes is unlikely, the comparisons in Figure 18 show that preventing these deaths could improve LE disparities. The enhancement of injury prevention measures and improved mental health access, especially for residents under 50 years old, would help improve LE in the areas discussed in this report.
The analysis of deaths for the causes examined in this report (accidental deaths overall, motor vehicle deaths, accidental deaths due to drug or alcohol use, homicide and gun-related deaths) strongly suggests that preventing injury associated deaths in younger age groups may play an important role in contributing to lower LEs in the North Tulsa Region and the ZIP codes with the lowest LEs. The higher percentages of deaths in people under 50 years old for these causes rather than causes such as heart disease and cancer is evidence that these causes may be contributing more to LE disparities in Tulsa County than previously considered. As noted by Fenelon et al., (2016), “Although research has focused on mortality of the population older than 50 years, much of the life expectancy gap reflects mortality at younger ages, when mortality is dominated by injury deaths, and many decades of expected life are lost.” In addition, disparities in drug- and alcohol-related deaths have been, “…associated with differential access to safety resources in the context of an increasingly toxic illicit drug supply, increased rates of polysubstance use, worsening economic precarity, and stark disparities in access to mental health and substance use programs” (Friedman & Hansen, 2024). The thought experiment conducted for this report confirms that addressing these issues and focusing on injury prevention among younger age groups could help to improve life expectancies.
Case, A., & Deaton, A. (2015). Rising morbidity and mortality in midlife among white non-Hispanic Americans in the 21st century. Proceedings of the National Academy of Sciences, 112(49), 15078–15083. https://doi.org/10.1073/pnas.1518393112
Centers for Disease Control and Prevention. (2024, May 15). Injury Prevention and Control. U.S. Department of Health and Human Services. https://www.cdc.gov/injury/about/index.html
Fenelon, A., Chen, L., & Baker, S. P. (2016). Major causes of injury death and the life expectancy gap between the United States and other high-income countries. JAMA, 315(6), 609–611.
https://doi.org/10.1001/jama.2015.15564
Friedman, J., & Hansen, H. (2024). Trends in deaths of despair by race and ethnicity from 1999 to 2022. JAMA Psychiatry, 81(7), 731–732. https://doi.org/10.1001/jamapsychiatry.2024.0303
Light, M. T., & Vachuska, K. (2024). Increased homicide played a key role in driving Black-White disparities in life expectancies among men during the COVID-19 pandemic. PLOS ONE, 19(8), Article e0308105. https://doi.org/10.1371/journal.pone.0308105
Ndugga, N., Hill, L., & Artiga, S. (2026). Racial disparities in life expectancy. KFF.
https://www.kff.org/racial-equity-and-health-policy/racial-disparities-in-life-expectancy/
Office for National Statistics. (2023, January 19). Period and cohort life expectancy explained. https://www.ons.gov.uk/peoplepopulationandcommunity/birthsdeathsandmarriages/lifeexpecta ncies/methodologies/periodandcohortlifeexpectancyexplained
Orgera, K., Kezh, A., Ranney, M., & Grover, A. (2024). Narrowing the gap: The burden of alcohol, drugs, and firearms in US life expectancy. Association of American Medical Colleges.
https://doi.org/10.15766/rai_r9oj8esu
Ortiz-Ospina, E. (2017). Life expectancy: What does this actually mean? Our World in Data. https://archive.ourworldindata.org/20260910-005924/life-expectancy-how-is-it-calculated-and-how-should-it-be-interpreted.html
Ramachandran, S. (2021, May 29). A Century After the Tulsa Massacre, Inequities in Medical Infrastructure Drive Health Gap. The Wall Street Journal.
https://www.wsj.com/health/healthcare/in-north-tulsa-inequities-in-medical-infrastructure-drive-health-gap-11622293203
Singh, G. K., & Lee, H. (2021). Marked disparities in life expectancy by education, poverty level, occupation, and housing tenure in the United States, 1997–2014. International Journal of Maternal and Child Health and AIDS, 10(1), 7–18. https://doi.org/10.21106/ijma.402
Nous avons 9 sites dans le comté de Tulsa qui offrent une variété de services pour vous aider, vous et votre famille, à rester en bonne santé.